About This Drill
AP Precalculus: Change in Tandem (Drill 1) is a Math practice drill covering Change in Tandem. It contains 5 original questions developed by Brian Stewart, a Barron's test prep author with over 20 years of tutoring experience.
Change in tandem questions on the AP® Precalculus exam test how output values behave as input values increase, using graphs, tables, and verbal descriptions. This drill covers identifying intervals where a function is increasing or decreasing, recognizing concavity and inflection points from graphical and numerical representations, and matching real-world narratives to the correct function behavior.
Questions & Explanations
Question 1. The graph of y = f(x) is shown below.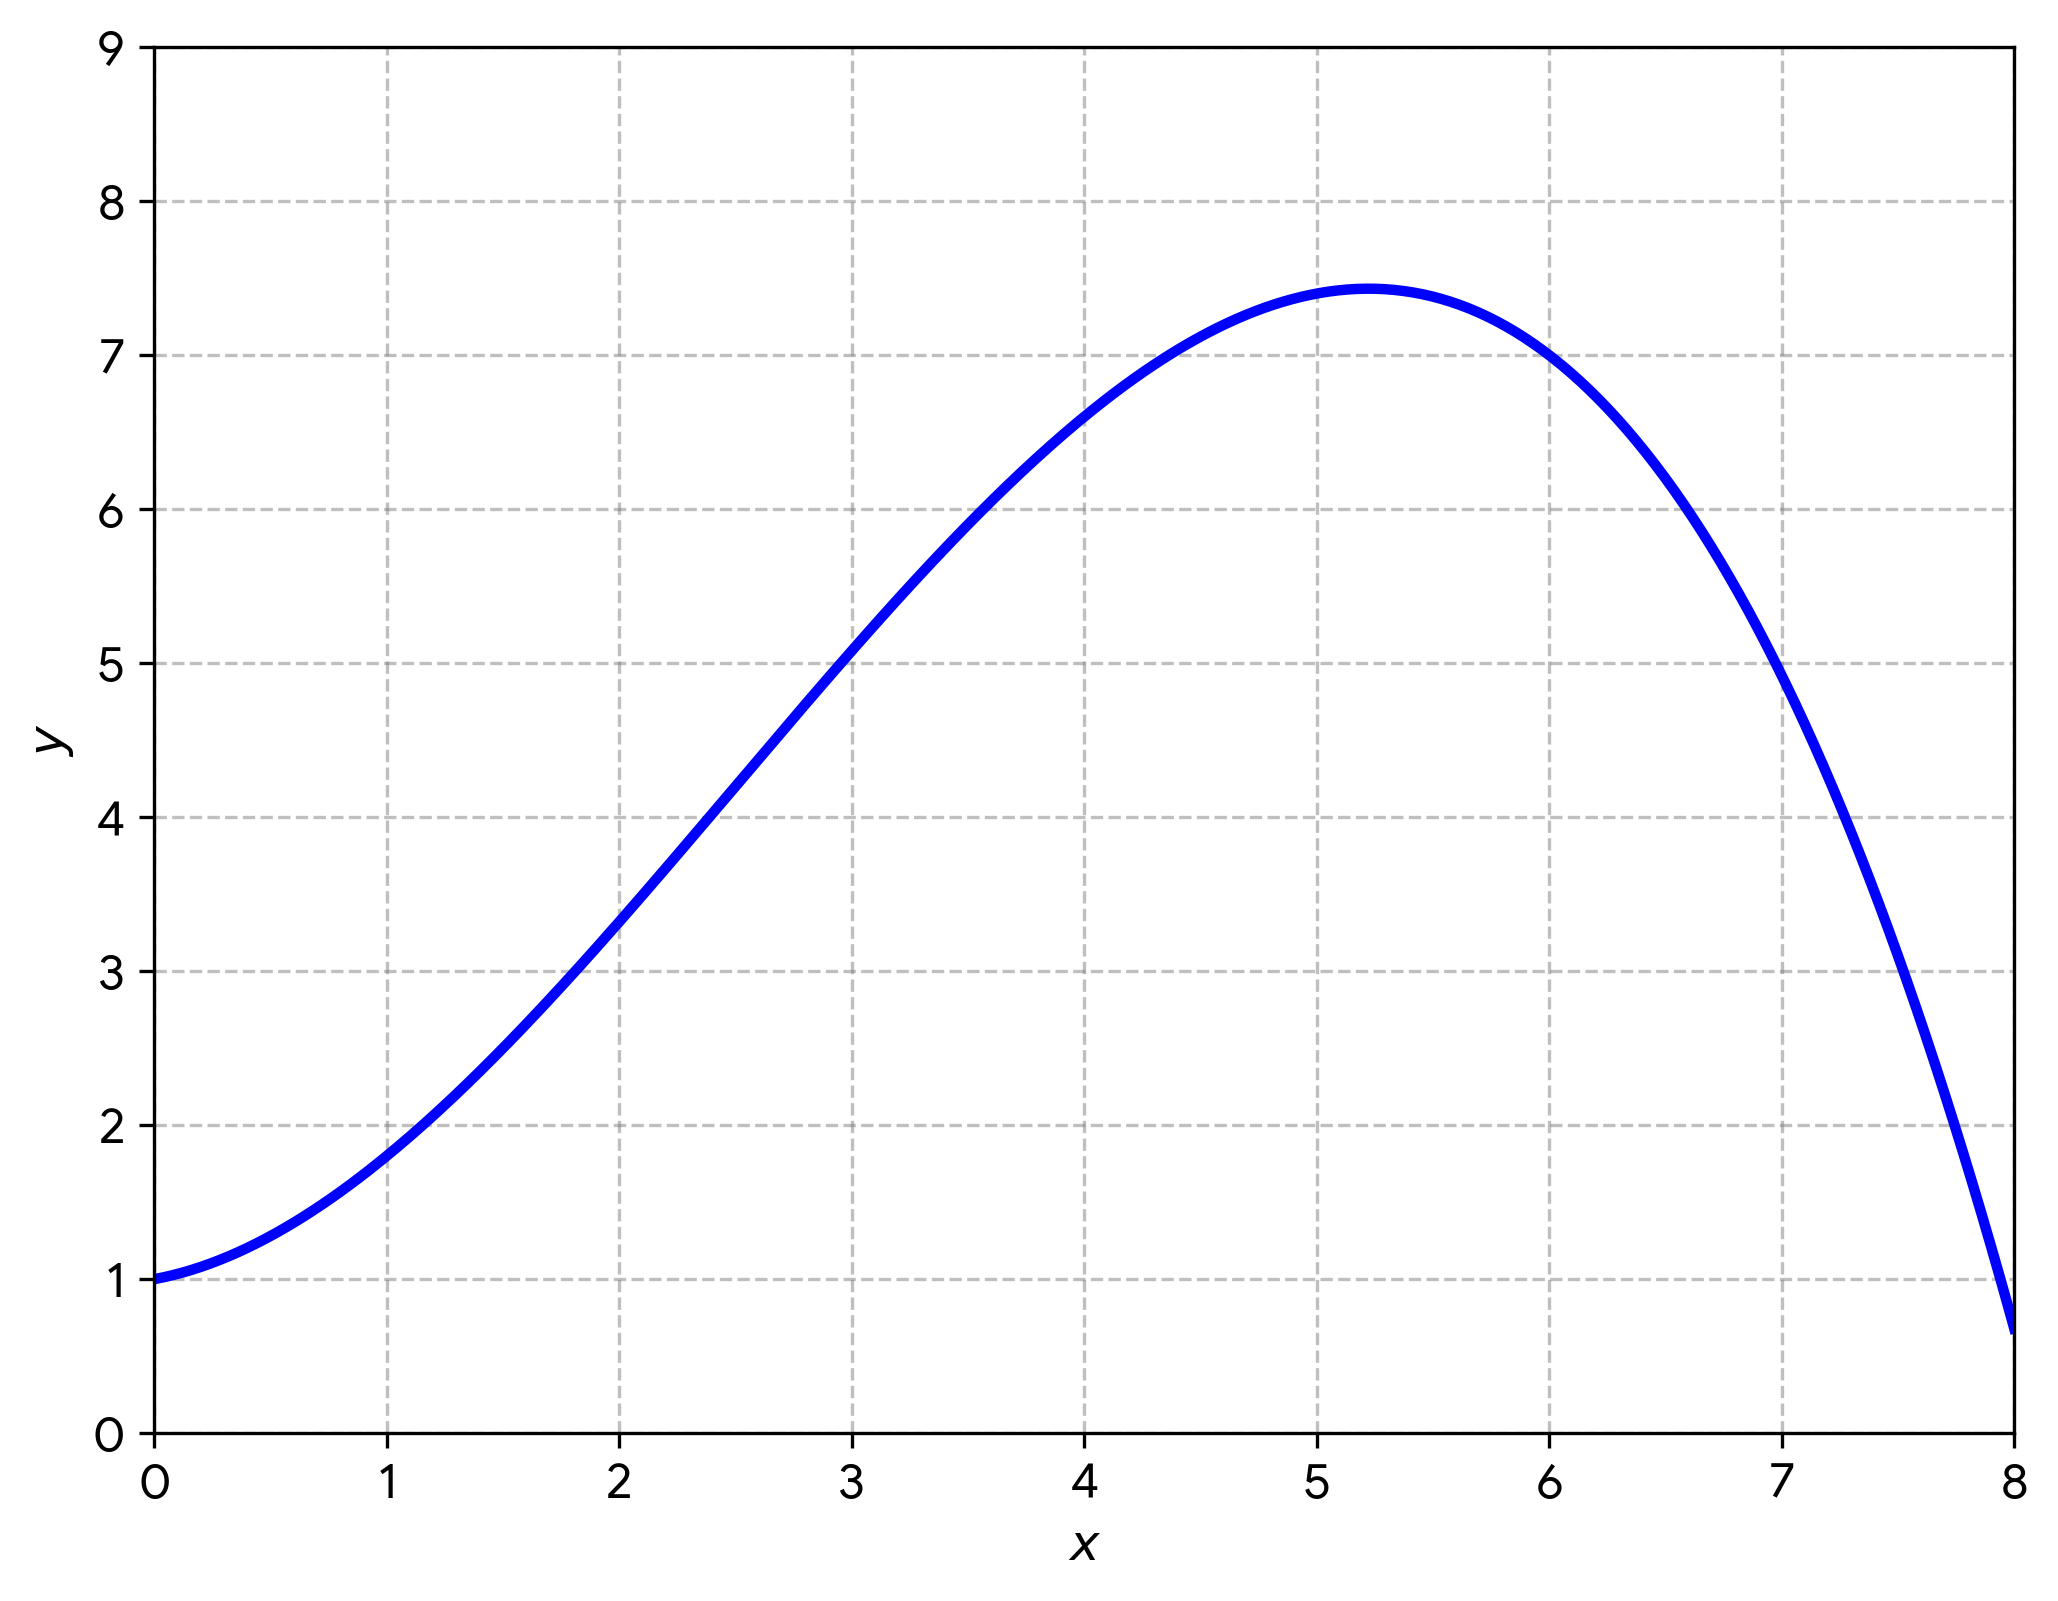
On which of the following intervals is f increasing and concave up?
- A) (0, 5)
- B) (2, 5)
- C) (0, 2) ✓
- D) (5, 8)
Explanation: Choice C is correct. On (0, 2), f is increasing and the graph bends upward, the slope is getting steeper, which is the definition of concave up (∪ shape). Choice A is incorrect because (0, 5) includes the interval (2, 5) where the graph is concave down, so a single concavity does not apply across the full interval. Choice B is incorrect because on (2, 5) the graph is concave down: the curve bends downward and the slope is decreasing as f approaches its peak. Choice D is incorrect because on (5, 8) f is decreasing, not increasing.
Question 2. The table below gives values of a function g at selected values of x.
| x | 1 | 2 | 3 | 4 |
|---|---|---|---|---|
| g(x) | 12 | 9 | 5 | 0 |
Which of the following statements correctly describes the behavior of g on the interval 1 ≤ x ≤ 4?
- A) g is increasing and the rate of change is constant.
- B) g is decreasing at a constant rate.
- C) g is decreasing and concave up.
- D) g is decreasing and the average rate of change is becoming more negative on each successive unit interval. ✓
Explanation: Choice D is correct. The outputs drop by 3 (from 12 to 9), then by 4 (from 9 to 5), then by 5 (from 5 to 0). Each successive average rate of change over a unit interval is more negative than the last (−3, then −4, then −5), confirming that g is decreasing and that the rate of decrease is growing in magnitude; this is concave down behavior. Choice A is incorrect because g is decreasing, not increasing. Choice B is incorrect because a constant rate of change would mean equal drops on each unit interval; the drops here are −3, −4, and −5, which are not equal. Choice C is incorrect because the successively larger drops indicate concave down behavior, not concave up, a concave up decreasing function would show the drops getting smaller, not larger.
Question 3. The graph of y = f(x) is shown below.
Which of the following correctly describes the behavior of f over the interval shown?
- A) f is concave down and increasing on (0, 8) with a local maximum at x ≈ 5.
- B) f is concave down and increasing on (0, 2), concave up and increasing on (2, 5), and has a local maximum at x ≈ 5 followed by a decreasing, concave down interval on (5, 8).
- C) f is concave up on (0, 5) with a local maximum at x ≈ 5, then decreasing and concave down on (5, 8).
- D) f is concave up and increasing on (0, 2), then concave down on (2, 8), with a local maximum at x ≈ 5. ✓
Explanation: Choice D is correct. On (0, 2) the curve bends upward and f is increasing, concave up. At x ≈ 2 there is an inflection point where concavity switches from concave up to concave down. From (2, 5) f continues increasing but the slope is now decreasing (concave down), reaching a local maximum at x ≈ 5. From (5, 8) f is decreasing and remains concave down, even though the curve steepens as it descends, the slope values are becoming more negative (decreasing), which confirms concave down behavior. The entire interval (2, 8) is therefore concave down. Choice A is incorrect because f is not concave down throughout; it is concave up on (0, 2). Choice B is incorrect because it reverses the concavity labels: (0, 2) is concave up, not concave down, and (2, 5) is concave down, not concave up. Choice C is incorrect because f is not concave up on all of (0, 5), the concavity switches to concave down at x ≈ 2.
Question 4. The graph of y = f(x) is shown below.
Which of the following statements about f must be true?
- A) f has a local minimum at x ≈ 2 and a local maximum at x ≈ 5, and f is concave up on (0, 8).
- B) f has an inflection point at x ≈ 2 where concavity changes from concave up to concave down, and f has a local maximum at x ≈ 5. ✓
- C) f has an inflection point at x ≈ 5 where f changes from increasing to decreasing, and f is concave down on (0, 5) for the given graph.
- D) f is concave up on (0, 5) and concave down on (5, 8), with a local maximum at x ≈ 5.
Explanation: Choice B is correct. The graph shows a clear change in bending direction at x ≈ 2: before that point the curve bends upward (concave up, slope increasing), and after it the curve bends downward (concave down, slope decreasing). This is the definition of an inflection point. At x ≈ 5, f reaches its highest value and transitions from increasing to decreasing; this is a local maximum. On (5, 8) f is decreasing and remains concave down, even though the curve steepens as it descends, the slope values are becoming more negative (decreasing), confirming concave down behavior. Choice A is incorrect because x ≈ 2 is not a local minimum, f is increasing through that point; it is an inflection point, not an extremum. Choice C is incorrect on two counts: x ≈ 5 is not an inflection point but a local maximum, and f is not concave down on all of (0, 5); it is concave up on (0, 2). Choice D is incorrect because the concavity switch happens at x ≈ 2, not x ≈ 5, on (2, 8) the graph is concave down, not just on (5, 8).
Question 5. A car travels along a straight road. Starting from rest, it accelerates so that its speed increases at an increasing rate, then slows to a complete stop at a stoplight, remains stopped for several seconds, and then accelerates again from rest with its speed increasing at an increasing rate. Which of the following best describes the distance d traveled by the car as a function of time t during the entire sequence?
- A) d is increasing at an increasing rate, then decreasing, then increasing at a constant rate.
- B) d is increasing at a constant rate, then constant, then increasing at a constant rate.
- C) d is increasing at an increasing rate, then constant, then increasing at an increasing rate. ✓
- D) d is increasing at a decreasing rate, then constant, then increasing at an increasing rate in this case.
Explanation: Choice C is correct. Distance always accumulates as long as the car is moving forward, so d never decreases. When speed increases at an increasing rate, each passing second adds more distance than the last, d is increasing at an increasing rate (concave up). When stopped at the light, no new distance accumulates, so d is constant. When the car accelerates again from rest, speed once again increases at an increasing rate and d resumes increasing at an increasing rate. Choice A is incorrect because d cannot decrease, the car moves forward or stops, never backward. Choice B is incorrect because a constant rate of increase in d requires constant speed; the car is accelerating, so d is concave up, not linear. Choice D is incorrect because it misidentifies the first phase: speed increasing at an increasing rate produces a concave up distance graph, not concave down.