About This Drill
AP Precalculus: Polynomial Functions and Rates of Change (Drill 3) is a Math practice drill covering Polynomial Functions and Rates of Change. It contains 5 original questions developed by Brian Stewart, a Barron's test prep author with over 20 years of tutoring experience.
Practice reading local extrema, inflection points, and rates of change from polynomial graphs and models. This AP® Precalculus drill covers Topic 1.4 skills tested on the AP® exam, including identifying where a polynomial function is increasing at an increasing or decreasing rate.
Questions & Explanations
Question 1. 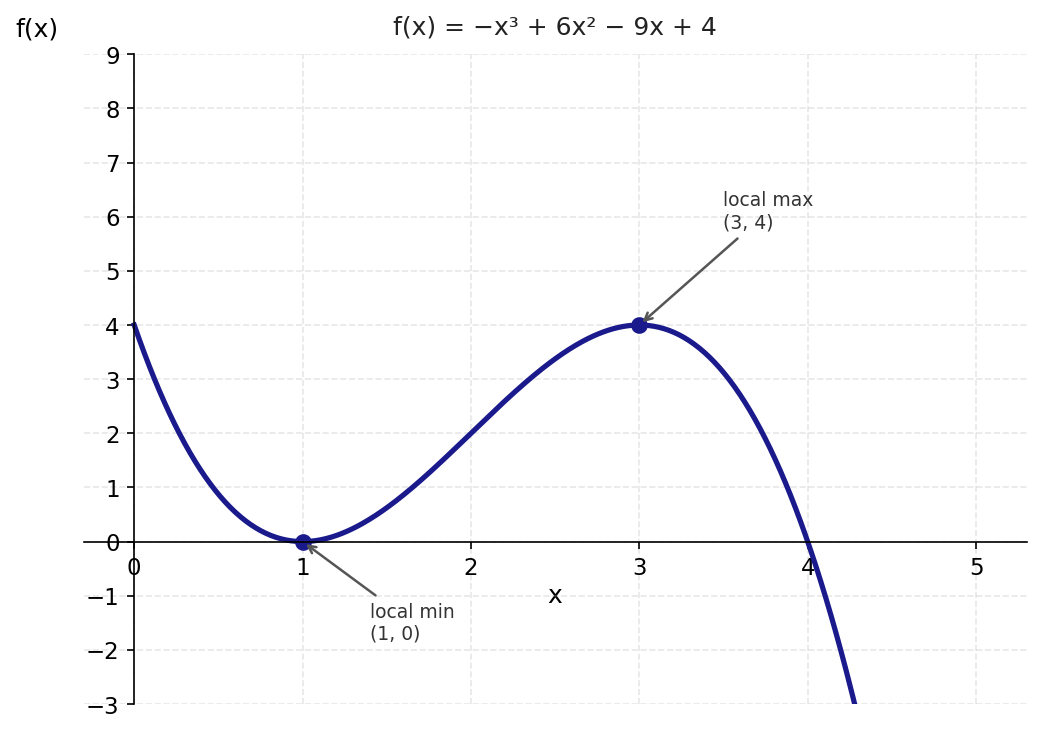
The graph of a polynomial function f is shown above for x on the interval [0, 5]. On which of the following intervals is f both increasing and concave up?
- A) (0, 1)
- B) (1, 2) ✓
- C) (1, 3)
- D) (2, 5)
Explanation: Choice B is correct. The function f has a local minimum at x = 1 and an inflection point at x = 2. On the interval (1, 2), f is increasing (moving away from its local minimum) and concave up (the slope is increasing, the curve bends upward like a ∪ shape). Both conditions are satisfied simultaneously only on (1, 2). Choice A is incorrect because on (0, 1), f is decreasing (heading toward its local minimum at x = 1), not increasing. Choice C is incorrect because the interval (1, 3) includes (2, 3), where f is increasing but concave down (the inflection point is at x = 2, so the concavity switches from up to down there). Choice D is incorrect because on (2, 5), f is concave down throughout (the slope is decreasing), and f is decreasing after the local maximum at x = 3.
Question 2. The table below shows selected values of a polynomial function h.
| x | 0 | 1 | 2 | 3 | 4 |
|---|---|---|---|---|---|
| h(x) | 2 | 5 | 10 | 17 | 26 |
Which of the following best describes the behavior of h on the interval [0, 4]?
- A) h is increasing at a constant rate because the first differences are all equal to 3.
- B) h is increasing at an increasing rate because the first differences are increasing. ✓
- C) h is increasing at a decreasing rate because the second differences are negative.
- D) h is increasing at a constant rate because the second differences are equal to 2.
Explanation: Choice B is correct. Computing first differences: 5−2=3, 10−5=5, 17−10=7, 26−17=9. The first differences are 3, 5, 7, 9; they are increasing, which means the rate of change itself is increasing. Therefore h is increasing at an increasing rate. The second differences are 5−3=2, 7−5=2, 9−7=2, which are constant and positive, confirming the function is concave up (increasing at an increasing rate) and consistent with a quadratic model. Choice A is incorrect because the first differences are not all equal to 3; only the first interval has a difference of 3. Choice C is incorrect because the second differences are positive (not negative), indicating concave up behavior, not a decreasing rate. Choice D is incorrect because constant second differences describe a quadratic function with a non-constant rate of change, not a constant rate of change (which would require constant first differences).
Question 3. The rate at which water flows into a reservoir is modeled by the function r(t) = −t2 + 4t + 5, where r is measured in thousands of gallons per hour and t is measured in hours, for 0 ≤ t ≤ 5. At what value of t does the flow rate change from increasing to decreasing?
- A) t = 1
- B) t = 2 ✓
- C) t = 4
- D) t = 5
Explanation: Choice B is correct. The function r(t) = −t² + 4t + 5 is a quadratic. Because the leading coefficient is negative (a = −1), the parabola opens downward, so r has its maximum at the vertex; r increases on the way up to the vertex and decreases on the way down. The t-coordinate of the vertex is t = −b/(2a) = −4/(2·(−1)) = 2. (Equivalently, completing the square gives r(t) = −(t − 2)² + 9, so the vertex is (2, 9).) Therefore the flow rate changes from increasing to decreasing at t = 2. Checking values confirms this: r(1) = 8, r(2) = 9, r(3) = 8. Choice A is incorrect because t = 1 is to the left of the vertex, where r is still increasing. Choice C is incorrect because t = 4 is to the right of the vertex, where r has been decreasing since t = 2. Choice D is incorrect because t = 5 is the right endpoint of the domain, not the point where r transitions from increasing to decreasing.
Question 4.
The graph of a polynomial function f is shown above for x on the interval [0, 5]. Which of the following correctly identifies a local extremum of f and describes the behavior of f at that point?
- A) f has a local maximum at x = 1 because f changes from decreasing to increasing there.
- B) f has a local minimum at x = 2 because f changes from concave up to concave down there.
- C) f has a local maximum at x = 3 because f is increasing for x 3 (near x = 3). ✓
- D) f has a local minimum at x = 3 because the slope of f equals zero at that point.
Explanation: Choice C is correct. The graph shows f increasing on (1, 3) and decreasing on (3, 5), confirming a local maximum at x = 3. The justification is valid: a local maximum occurs where f transitions from increasing to decreasing, which is exactly what happens near x = 3. Choice A is incorrect because x = 1 is a local minimum (f is decreasing for 0 < x < 1 and increasing for 1 < x < 3), not a local maximum. The description "changes from decreasing to increasing" correctly describes a local minimum, not a maximum. Choice B is incorrect because x = 2 is an inflection point (where concavity changes from up to down), not a local extremum. A change in concavity does not produce a local maximum or minimum. Choice D is incorrect because x = 3 is indeed a local maximum, not a local minimum. Although the slope of f does equal zero at x = 3, the correct identification is local maximum, not local minimum.
Question 5. The function f is a polynomial with f(1) = 0 and f(3) = 4. The average rate of change of f on [1, 3] is 2. A student claims that f must be increasing at a constant rate on [1, 3]. Which of the following, if true, would prove the student's claim is incorrect?
- A) The average rate of change of f on [1, 2] is also equal to 2.
- B) f(2) = 3, giving an average rate of change of 3 on [1, 2] and 1 on [2, 3]. ✓
- C) f(2) = 2, which is consistent with f increasing at a constant rate on [1, 3].
- D) The average rate of change of f on [0, 4] is also equal to 2.
Explanation: Choice B is correct. If f(2) = 3, then the average rate of change on [1, 2] is (3 − 0)/(2 − 1) = 3, and on [2, 3] is (4 − 3)/(3 − 2) = 1. These sub-interval rates are different (3 ≠ 1), which directly proves f is not changing at a constant rate on [1, 3]. A function with a constant rate of change must have the same average rate of change on every sub-interval. Choice A is incorrect because it is consistent with, not contradictory to, a constant rate of change. If the average rate on [1, 2] is also 2, f could still be linear (constant rate) on that portion. Choice C is incorrect as the best answer, though it does contain valid reasoning: a local minimum in (1, 3) would imply the rate of change is not constant, since a function with a constant rate of change (a linear function) cannot have interior extrema. However, Choice B provides a more direct numerical contradiction; it gives specific values showing the rate differs on sub-intervals, making B the stronger and more complete answer. Choice D is incorrect because the average rate on a larger interval being 2 provides no information about whether f has a constant rate on [1, 3] specifically.